
Week 13 - Climate: Background Info and Data

 Lab:

This week in lab we worked to look at some data from different articles while also conducting our own research to prove that climate change is happening. My group read the article from Radio Iowa and wrote this summary: "More likely to be dangerously hot, could affect our livestock and resources as we farm for a living, could result in more flooding too. WE ARE SCREWED but there are adaptations that we can make to reduce greenhouse gases." Our website had little to no actual data. From there, we split into bigger groups doing research on precipitation changes in the state of Iowa and how we could use this data to prove climate change and write a climate statement. Some of the data pieces that I wrote down include:

  • June 2019 - “Iowa has had 50.73 inches of precipitation from June 2018 through May 2019 , about 16 inches more than normal”

  • Number of Days with total precipitation greater than or equal to 3.00 cm

    • In 1895-1909 the number of days were between 7-9 days. 

    • Since 1944 there has been a gradual increase in our number of days ranging from 10 to 13 in 2000

    • Number of snowy days is dramatically decreasing with 2007 having 20.7 inches and 2018 having 0. Wow.

Then we got into larger groups to share all of our information with each other and were tasked to come up with our own climate
statement and create a poster including the statement and data. 

Lecture:

Why do some regions have a hot climate, and others have a cold one?

  • L.O.W.E.R. Near Water

    • Latitude: distance from the equator is a key factor in determining whether climate is cold or hot

      • Places closer to the north and south poles have color temperature 

      • Places near the equator have a warmer temperature

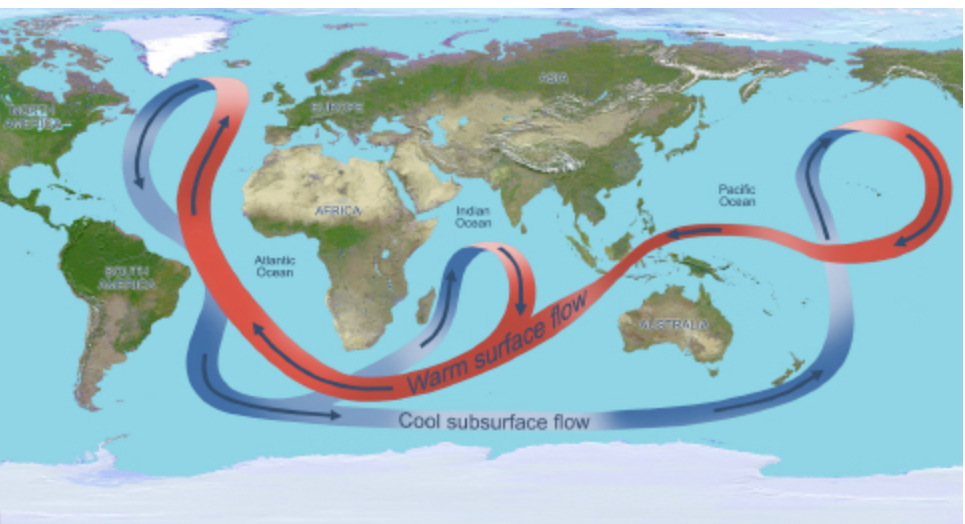
    • Ocean Currents: temperature of ocean currents affect the temperature of the air that passes over it 

    • Wind/Air masses - an air mass is a large volume of air that takes on the climatic conditions in the area where it is formed

    • Elevation - the higher the altitude the colder the temp

      • As the air rises, it expands because of the lower air pressure

      • As the air expands it cools

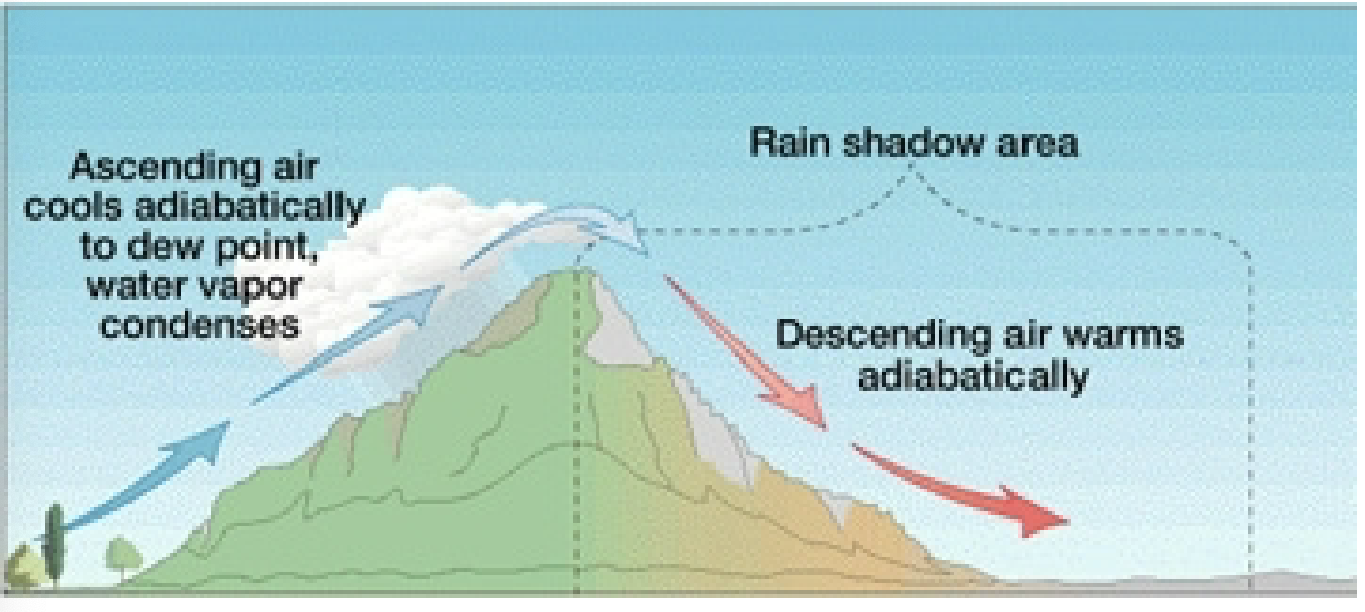
    • Relief - precipitation created when an air mass rises to cross a mountain barrier → 

      • An adiabatic process is one in which no heat is gained or lost by the system

    • Near Water - in the summer, water acts like an air conditioner to keep the air temperatures cool  → 

      • In the winter water acts like a heater to keep the temperatures from getting too cold

      • Continental Climate - Away from water

      • Maritime Climate - Close to water

  • Evidence of Climate Change

    • Glacier retreat

  • Albedo Effect - Cold Sinks - convection currents (see above pic)

    • If I have a black shirt and white pants… and we are outside in the sun, the black shirt will heat up faster

      • Black absorbs the sunlight

      • White reflects the sunlight

  • Driving Question: How does climate change affect sea level??

    • Glaciers and ice are reflecting the light off the earth

    • Now we are absorbing the heat it due to the decrease of ice 

    • Greenland alone - 7.3 m of sea level rise 

    • Water expands when it expands and turns into ice 

    • Water when it heats it also expands 

    • Coral reefs Bleaching - 80% is bleaching and dying… scary

      • Ocean temps are warming up 

  • There are lots of things we can do

    • Paris agreement - international treaty on climate change that was created to limit global warming to a change of 2 degrees Celsius - we have already warmed 1 degree Celsius since pre-industrial times 

    • Oil giants were urging trump to honor his predecessors to climate commitments


Textbook:

What I learned: I learned more about what the atmosphere does to protect Earth and us living on the planet. Prior to reading, I knew that one of the atmospheres purposes is to protect us from harmful UV that the sun gives off, but the reading also taught me that the atmosphere regulates temperature, weather, and climate.  

What I found most helpful: The photos and animation clips were very helpful in my understand of the carbon cycle and the greenhouse effect. They were both things that I was familiar with but the pictures help me to better grasp what these look like on Earth. I particularly loved the greenhouse effect animation because after it shows the some of the energy being reflected back to space, the other energy is being absorbed by the Earth and can see how it acts as a blanket keeping the planet warm and protected from space. 

Comments

Popular posts from this blog

Week 2 - How do we make a race exciting between people who run at different speeds?

Lab:       Today, we continued our thinking about how we can support play that is exciting but not dangerous. We narrowed in on how we can make a race exciting between people who run at different speeds and started by watching a video of "The Freeze" racing fans but giving each of them a head start. Each race he caught up to his opponent and ended up beating them in every clip of the video. We used the video as an example for our big question and inquiry for the day. We were asked to use our model of a race to develop a method to ensure that a race is exciting between two racers. Our groups thinking was that we needed to calculate our distance per second so that when we were matched up against our opponent, we can calculate the distance head start that they would need for the race to be a close call.  Our Data Table      Based off of our calculations we multiplied them by the race length to figure out how long each racer would take to complete the...

Week 9 - History of the Earth

 Lab: This week in Lab we worked to create a realistic and to scale timeline of the creation of the universe all the way up until today. We divided our timeline into 14 meters to have 1 meter represent a billion years. Before we got to find out when humans, animals, and plants all appeared on Earth, we placed our initial individual guesses on the timeline so that we can see how that differed from when these things actually appeared/came to be. It was actually crazy to see how close dinosaurs, the first land animals, first land plants, humans, and the creation of the moon were in our timeline. I feel like in all our our educations, we would make these timelines but they weren't up to scale and they didn't accurately represent the amount of time between each of these milestones. Lecture: Exam Textbook: History of the Earth I learned that the Earth was almost entirely ice at least 3 times in it's history. I remember reading about one of these event's briefly but didn't...

Week 11 - Rocks and the Rock Cycle

Lab In lab we started by talking about the law of superposition... everyones fav! This law basically states that the older stuff is at the bottom and the longest is at the top. We used this to work to place different layers of rock in order from oldest to youngest based off different photos. Immediately, I was taken back to my ninth grade earth and space science class and I could remember doing exactly what we were doing in lab, but back in early high school... props to Ms. Howlett :)  Then we moved into talking about different characteristics that sand from different places had. We looked closely at sand from beaches, dunes, and rivers around the world. Our group decided to look at each group and write down observations about each sample. All of the different rock types were from different areas and all had different colors, were different shapes, and just looked different. We came up with some characteristics for sand found in rivers, dunes, and beach's.  River Sand Characte...